UX research
Improving feedback and actionable insights

Summary
The System Usability Scale (SUS) is a fixed set of 10 questions used to evaluate the perceived usability of products and services.
SUS was introduced as mandatory tool at Maersk to capture usability of our platforms by Maersk Executive Leadersip Team in 2023. Our UX team have expanded the survey by including more questions to better understand our users feedback, so the team can turn it into actionable insights to further improve and build a better platform.
Goal:
-
Drive engagement
-
Reduce time required for completion
-
Provide survey localisation
-
Ensure users that their feedbacks are heard
-
Can gather actionable insights to improve score
Problem
The old survey execution had very low response rate and lack clear understanding of where and what the exact user issues are on the platform. In Q4 of 2022, the feedback only captured 45 (approx. 20% of total users) respondants, which is approximtely >20% of our total number of users. Through communication with actual users we are able to identify some key problems:
-
Users feel there is no point in doing the survey as nothing will be changed
-
The questions are in English and majority of users is not native English speakers
-
It takes up time from their busy schedule
"I don't want to spend time on the survey, nothing will be changed even if I respond"
- CX user. Chengdu, China

Old SUS survey
Solution
-
Slim down pages and questions in the actual survey
-
Currently there are a lot of extra pages and questions that are not related to SUS
-
-
Introduce a new survey in Typeform that has been initially tested with 4 previous respondents
-
The current form created in MS Forms is very tedious and uninspiring
-
Feedback quotes on the new form:
-
“Seems more like a game”,
-
“The old one looks boring compared to this”,
-
“This one is more clear”,
-
“I like the gift cards”,
-
“It gives more focus for each question”
-
-
-
Driving up “engagement” thereby decreasing “churn”, driving up responses
-
Create 2 different versions: English + Chinese
-
A lot of our users are Chinese speaking and it’s difficult for them to understand the current questions (feedback from Chinese users, that they would prefer a Chinese version)
-
Driving up “engagement” thereby decreasing “churn”, driving up # responses
-
-


Impact
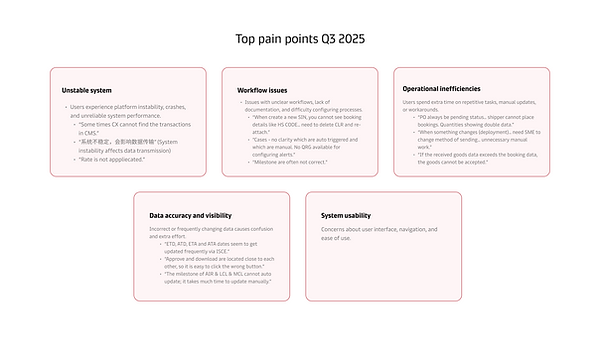
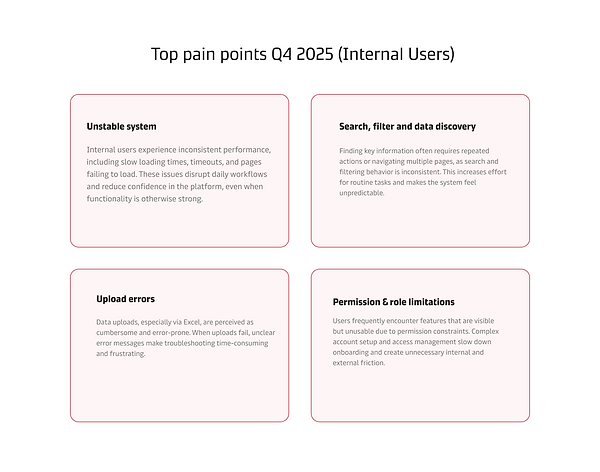
By Q1 of 2026, the total number of feedback has increased to around 600 respondants (+92% compared to 2022). The survey has also been adjusted to capture where the actual pain points are occuring, allow UX team to followup with the correct respondants. With the increased number of respondants, the UX team has been able to conclude on more concrete painpoints for the UX team to identify key areas for imporvements:
-
Fix the high-traffic pages where users report the most friction
-
Address poor data flows between capabilitie
-
Performance: SCP has become remarkable slow. In interview with users load times are alarming. Setup measurements to reflect the actual user experience, and continue to monitor and improve the performance.
-
Onboard smarter & improve learning materials– since new users drag scores down, improvements in early user experience could shift the average.
+92%
Increase in survey responses due to framework since 2022. Allowing team to identify key initiatives to build a better platform.
More responses, more insights
With the increased response rate, we have reliable data source each quarter to identify key areas of improvements to tackle. The results are presented and shared with the entire SCP team and teams are required to add these to their backlogs.